AdaptiveEcomm

The Only E-Commerce & ERP Solution
Fully Integrated Without 3rd Party Plugins


Strategy, Organisational Charts & Roadmaps


Strategy

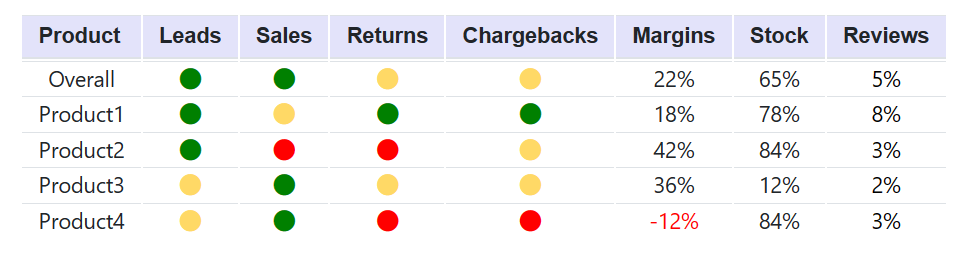
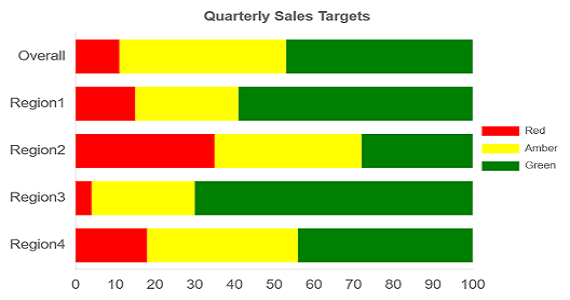
Set and monitor a number of strategy-related metrics and performance targets, such as leads, sales, margins or other OKRs (Objectives and Key Results).

Roadmaps/Swimlanes

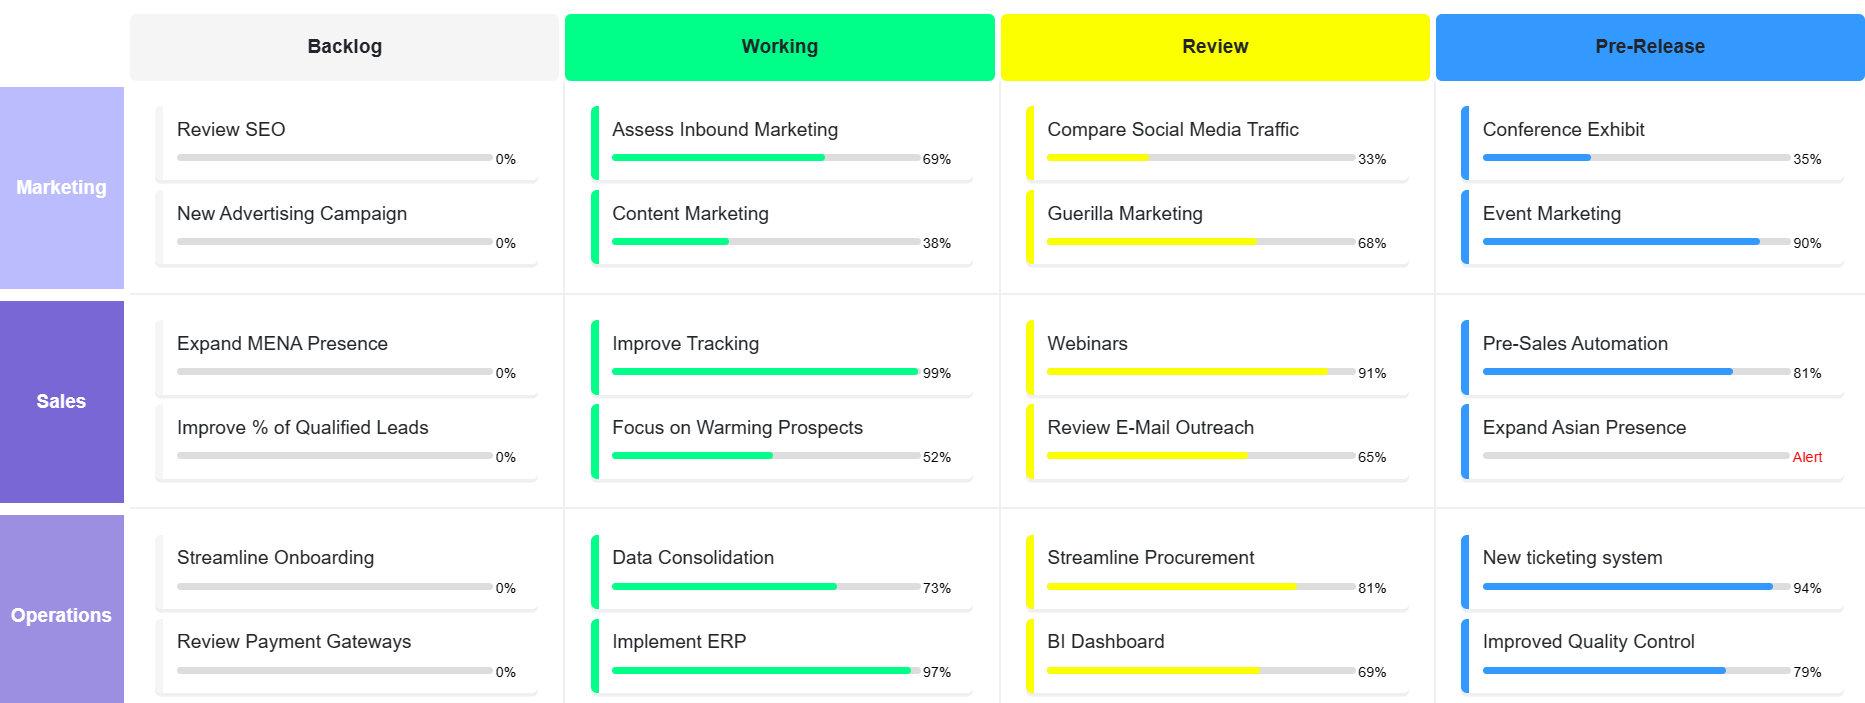
Track and discuss strategy/progress. Choose headings such as Backlog/Working or for a timeline select Q1 to Q4. Select Themes for the first column e.g. marketing/operations.

Organisational Charts

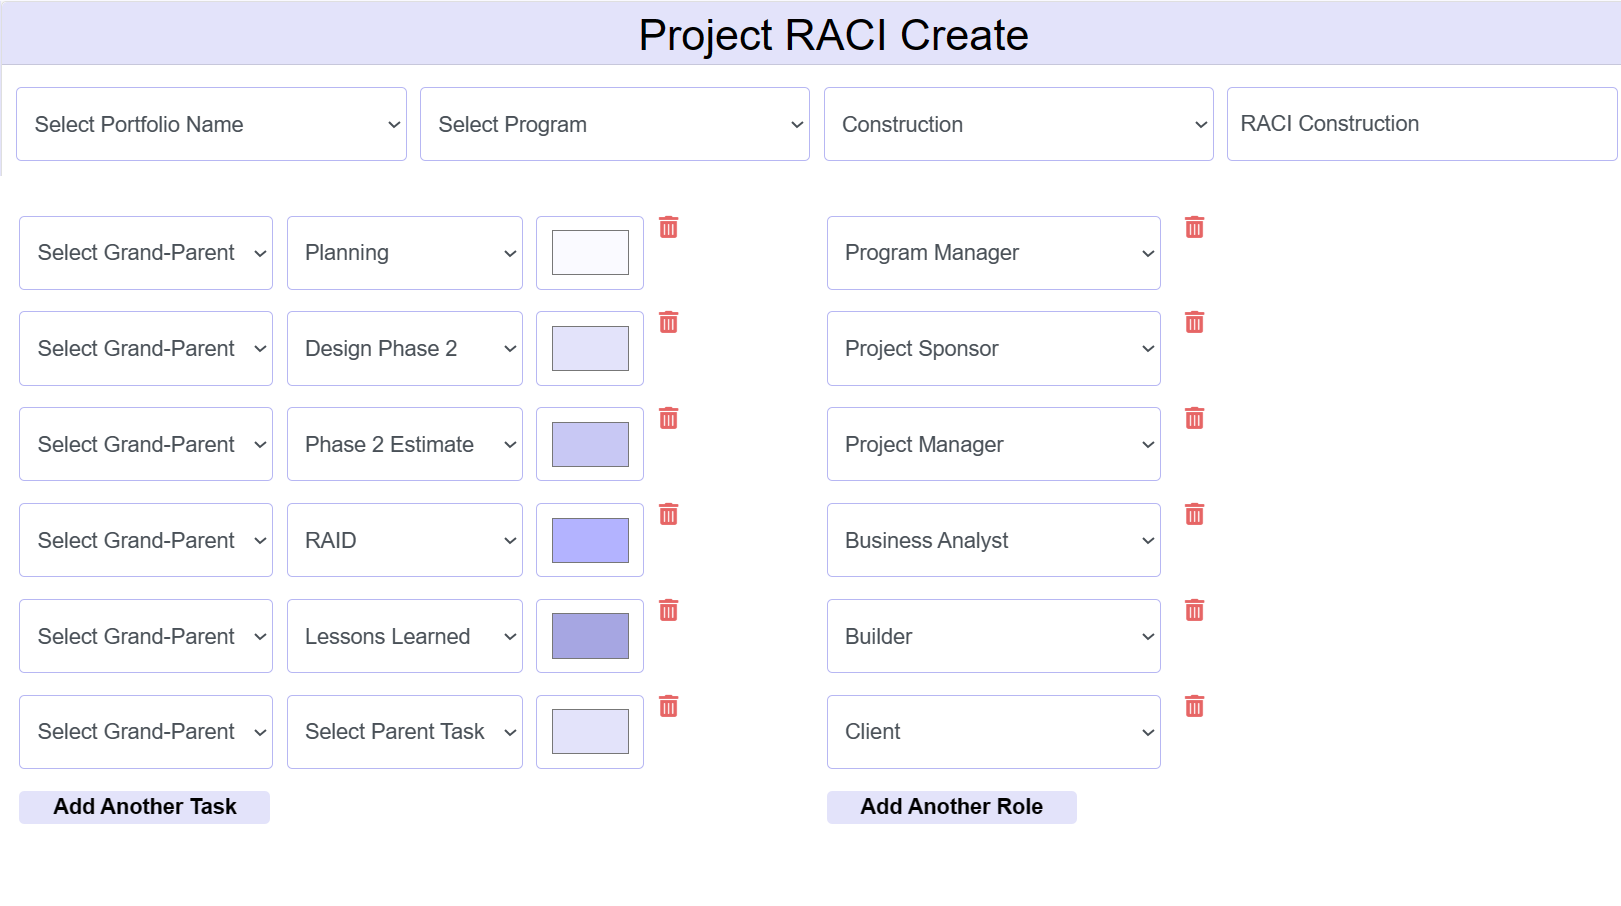
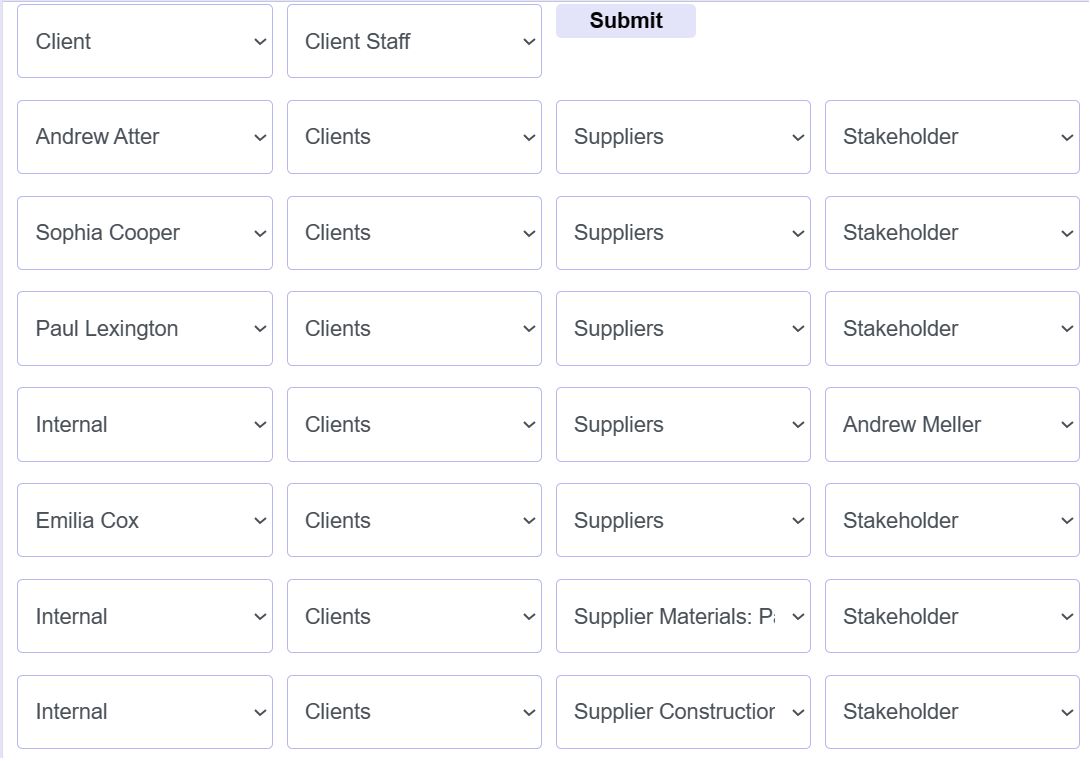
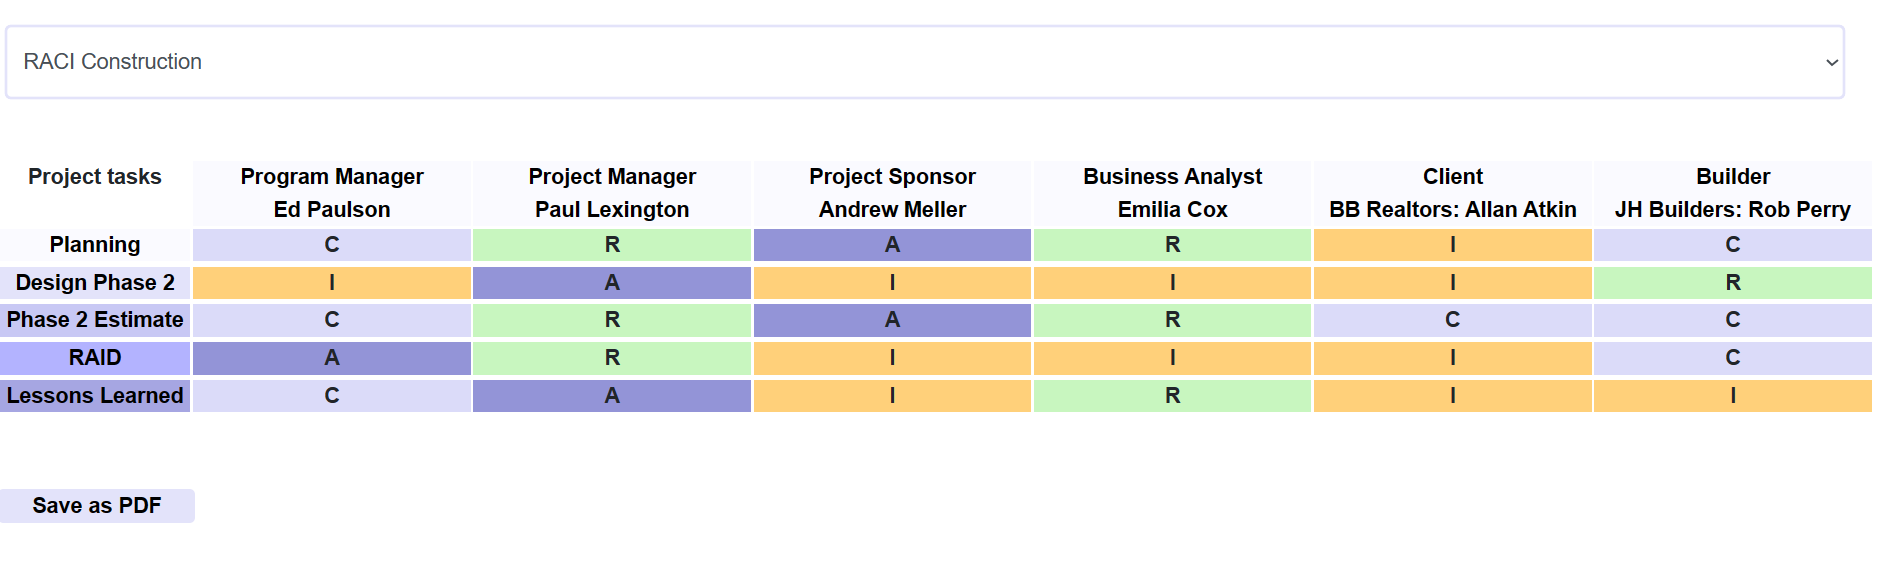
Access 6 types of RACI Charts/RACI Matrices which are organisational charts describing who is responsible, accountable, consulted and informed.


ecommerce-performance
Performance Metrics & Integrated Business Intelligence
  • Performance Metrics, BI & Visualisations: Built-in BI lets you monitor performance across multiple metrics, such as: leads, sales, returns, chargebacks, margins, stock levels and reviews. Customise your own metrics - select which ones you wish to monitor and for which products/product groups


Sales Targets & OKRs
  • Regions: Set country, regional or city targets for sales and monitor on a weekly, monthly or quarterly basis

  • RAG: The well-known Red-Amber-Green (RAG) colour-coding provides for faster monitoring

  • OKRs: Sales Targets can link to our OKR (Objectives and Key Results) module, where targets trickle down across teams and aggregate for at the team/dept/group level

  • OKR Details: Further details on can be found here
ecommerce-monthly-quarterly-sales-targets


swimlane
Roadmaps: Swimlanes
  • Strategy: Roadmaps are useful for meetings to show strategy and discuss progress. Choose your own headings, such as Backlog/Working or for a timeline select Q1 to Q4. Select Themes for the first column, such as marketing or operations

  • Alerts & Progress: Overdue is shown in red, while estimated percentage complete is displayed within each segment. Select from multiple templates


RACI: Organisational Charts


AdaptiveEComm offers 6 types of RACI Charts/RACI Matrices which are organisational charts describing who is responsible, accountable, consulted and informed. These are also referred to as Responsibility Assignment Matrices (RAM). They are quick and simple to set-up and provide a significant time and cost-saving. Not only do they assign responsibilities - they can be extended to inform all teams, cross-matrix, who provides what services in an organisation, whether a BI report, data or compliance request. The larger the firm, the harder it is for newcomers and junior staff to know relevant contact points.


6 Organisational Charts

Methodology Composition
RACI: Responsible: The person doing the task. Multiple people can be assigned Responsible
Accountable: The Project/Product Manager who assigns and reviews team work
Consulted: Those providing input, such as Sponsors or internal/external Stakeholders
Informed: Those requiring high level updates - typically Stakeholders/Management
RASCI: Responsible: The person doing the task. Multiple people can be assigned Responsible
Accountable: The Project/Product Manager who assigns and reviews team work
Supportive: Someone helping to do the work, supporting those Responsible
Consulted: Those providing input, such as Sponsors or internal/external Stakeholders
Informed: Those requiring high level updates - typically Stakeholders/Management
CARS: Communicate: This includes those Consulted and Informed
Approve: This is the decision-maker
Responsible: The person doing the work
Support: Those helping do the work
RAS: Responsible: The person/people doing the work
Approve: This is the decision-maker
Support: Those helping do the work
DACI: Drivers: The person/people doing the work
Approvers: These are the decision-makers
Contributor: Those consulted on the task
Informed: Those requiring high level updates - typically Stakeholders/Management
CLAM: Contributor: Includes those consulted and those doing the work
Lead: The Project/Product Manager who assigns and reviews work
Approvers: These are the decision-makers
Monitor: Those requiring high level updates - typically Stakeholders/Management


raci-create
Create Organisational Chart
  • Enterprise-Wide RACI: Select Portfolio, Program, Project, Group or Dept.

  • Parent-Child: All filters work on a "parent-child" basis, where selecting a portfolio will only display programs belonging to this portfolio. Select a program and only display projects belonging to this program. Select group and only display teams belonging to this Group

  • Add Tasks & Roles: Then add as many grandparent topics or parent tasks as required and select a colour for each row. Next add all the Roles involved


Add People
  • Add People: This includes staff, stakeholders, suppliers and clients. The dropdowns display all names and companies associated with the project

  • Dropdowns: The dropdowns display all names and companies associated with the project

  • Clients & Suppliers: Clients and Suppliers must already be in the system and associated with the Project/Group to display. However, Clients work slightly differently. If a Client associated with a project/group does not yet display in the dropdown, click Add Client in the top row and select the client and relevant client staff from the list provided. These clients will now appear below in the Client dropdowns

raci-create-staff


raci-create-body
Create Chart Body
  • Select Methodology: Select your preferred methodology: RACI, RASCI, DACI etc. If you select RACI you can only select Responsible, Accountable, Consulted or Informed. You cannot mix methodologies within a single chart. If you need to differentiate support staff, try RASCI instead

  • Create: For each task select who is Responsible, Accountable, Consulted or Informed. This will fill out the body of the RACI chart


View RACI Chart
  • Columns: Although columns usually show only role, we also display each person's name, which is useful for larger firms and cross-matrix teams

  • Rows & Body: Each row represents a task. If the RACI methodology was selected, the letters in the body represent Responsible, Accountable, Consulted or Informed. These charts can be saved as PDF and shared. A separate module provides editing

raci-chart


swimlane
Roadmaps: Swimlanes
  • Strategy: Roadmaps are useful for meetings to show strategy and discuss progress. Choose your own headings, such as Backlog/Working or for a timeline select Q1 to Q4. Select Themes for the first column, such as marketing or operations

  • Alerts & Progress: Overdue is shown in red, while estimated percentage complete is displayed within each segment. Select from multiple templates


Return to Main Menu


Request a demo or consultation