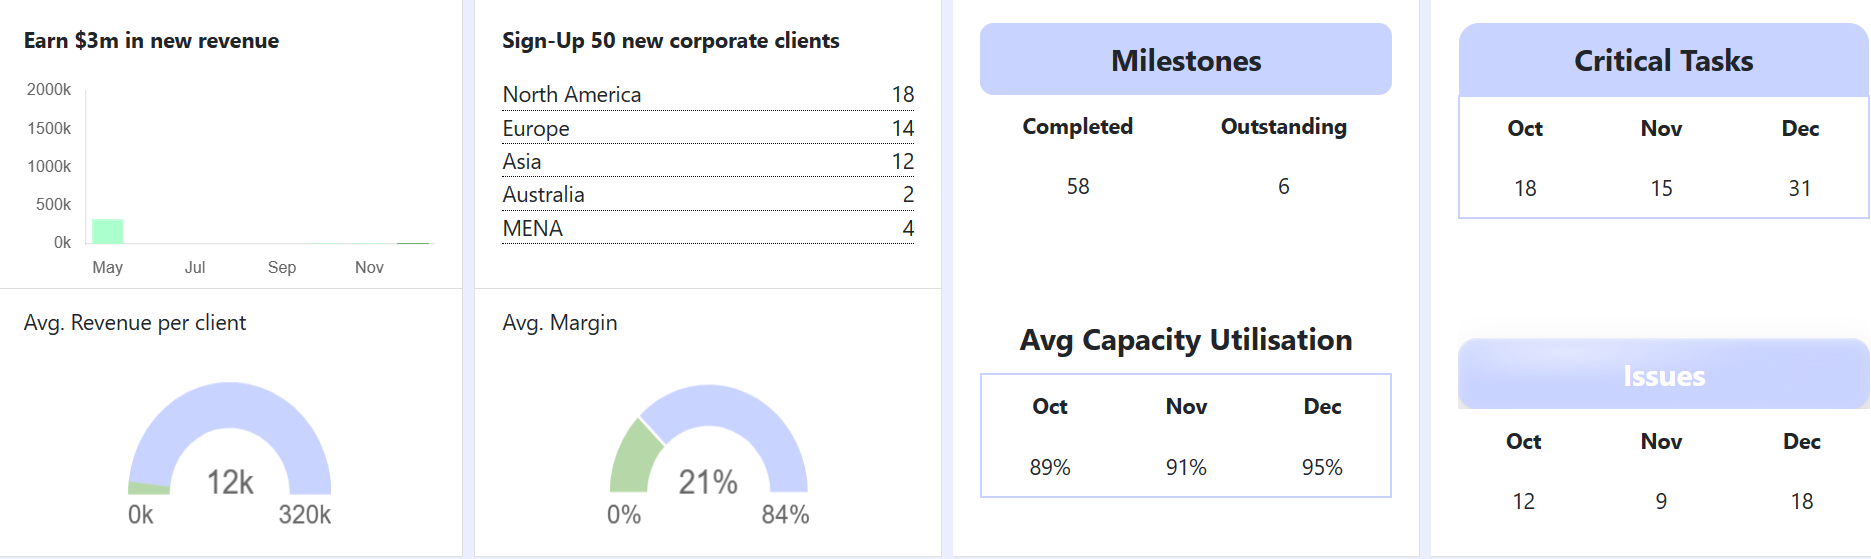
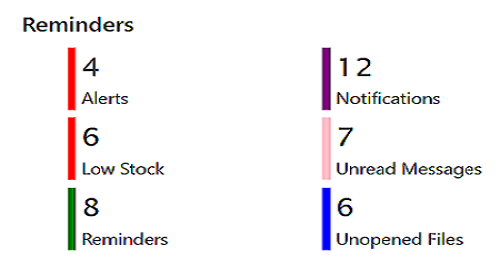
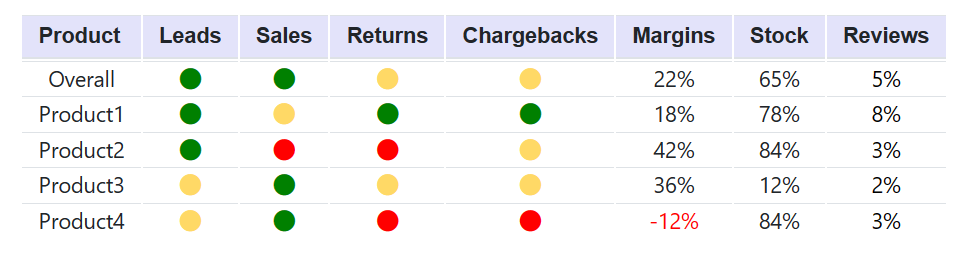
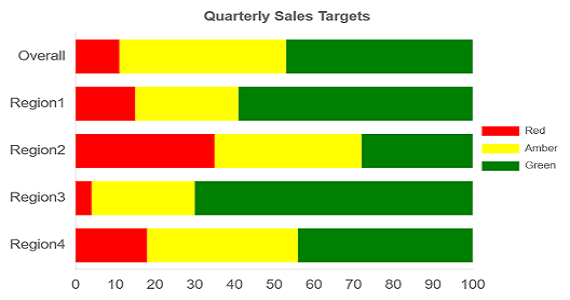
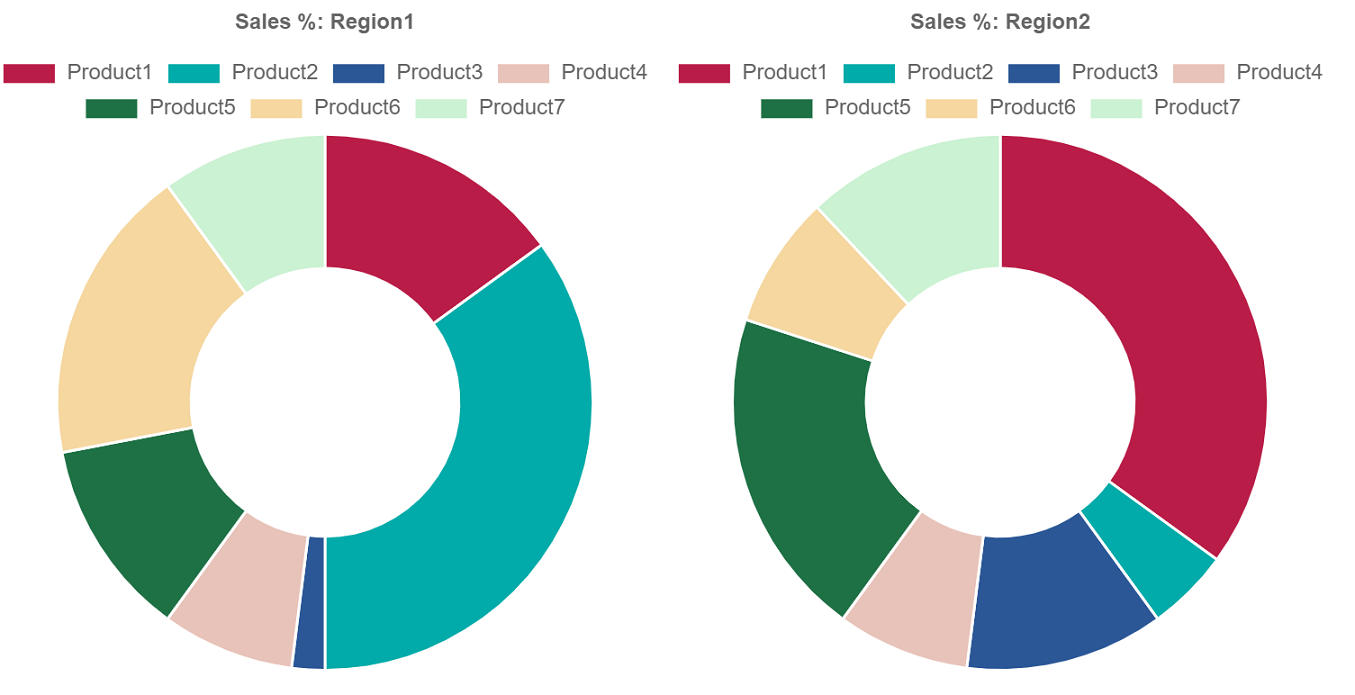
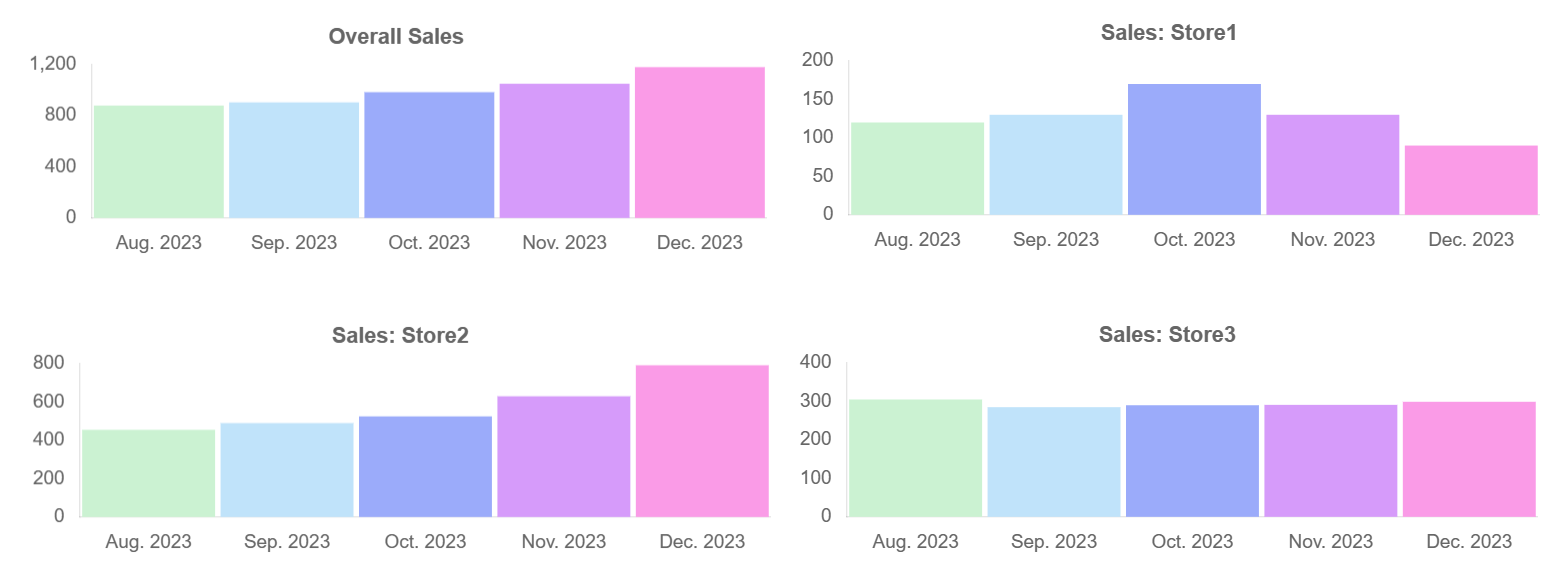
Customised Dashboards: Select any number of items to add to your dashboard. This allows Management to view high level data, whereas teams can select different items. Vendors, Clients and Suppliers each have their own dashboards.
AdaptiveEComm provides a single source of truth: All data is stored in a single database. This data is used to produce multiple reports and visualisations, without the need for a 3rd party BI tool. Additional reports can be customised.