Adaptive PPPM2.0

A Patent-Pending Leap Forward
Driving Success to the Next Level


Analytics Management


PPPM2.0 offers a wide array of analytics, ranging from Critical Earned Value, EVM, OKRs and KPIs, through to Scenario Analysis and customised dashboards.


Critical Earned Value

Critical EVM is much more powerful than traditional EVM as it focuses on EV from critical resources or processes most likely to impact earned value.

OKRs & KPIs

Set Objectives and Key Results (OKRs) or Key Performance Indicators (KPIs) for Portfolios, Programs and Projects. Monitor performance and adjust goals.

Scenario Analysis

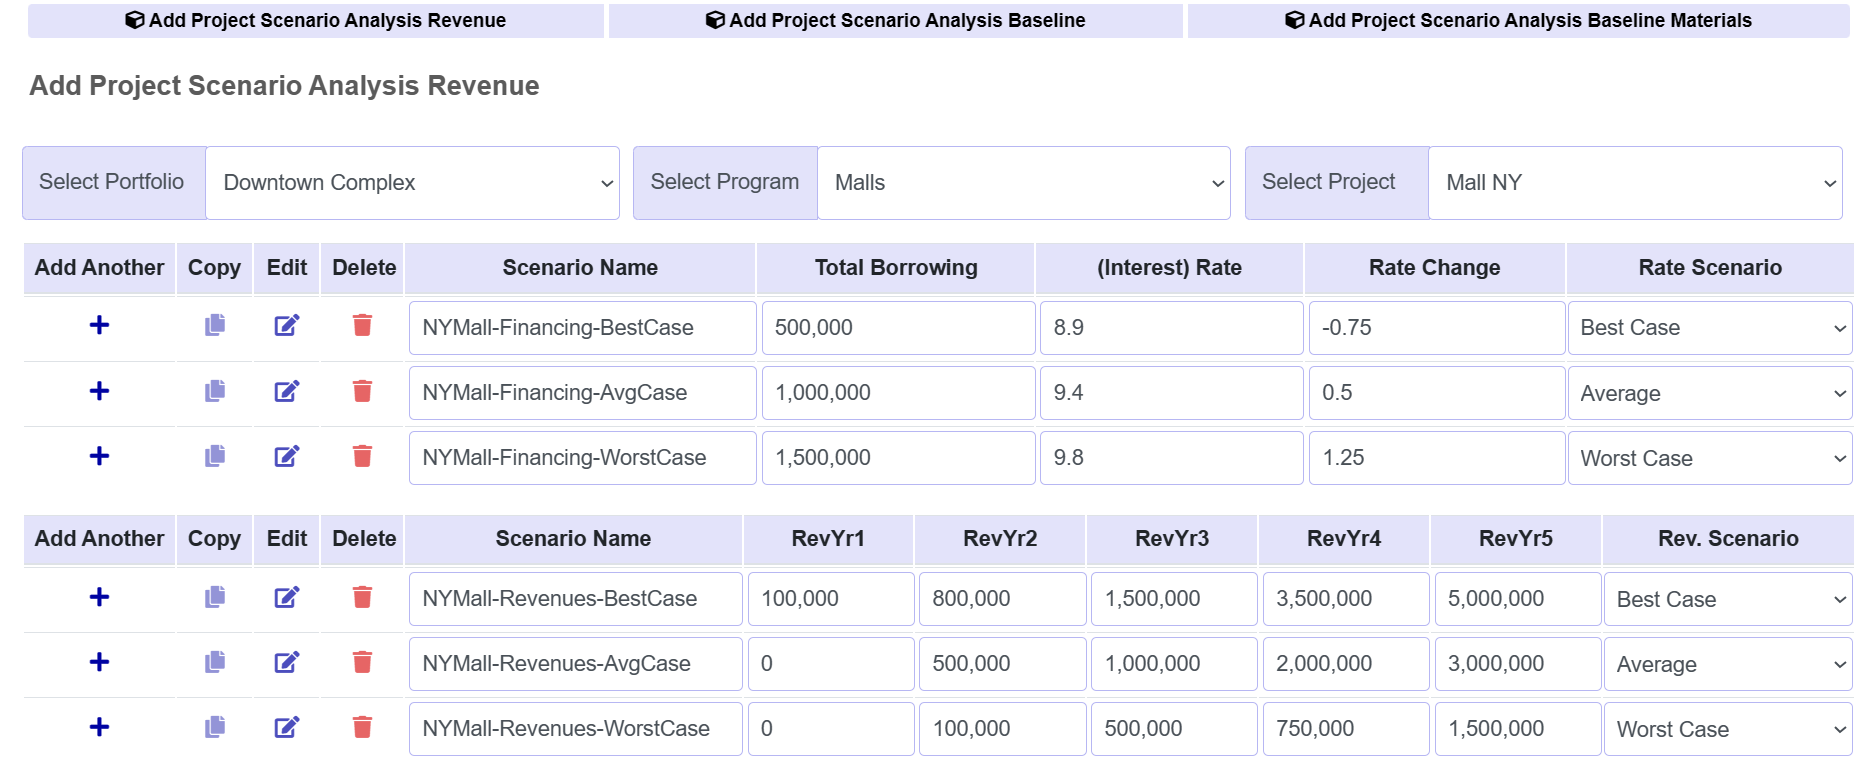
First run Scenario Analysis for a range of best and worst case outcomes. Use expected ROI and input/votes from colleagues to set Project priorities.

Customised Dashboards

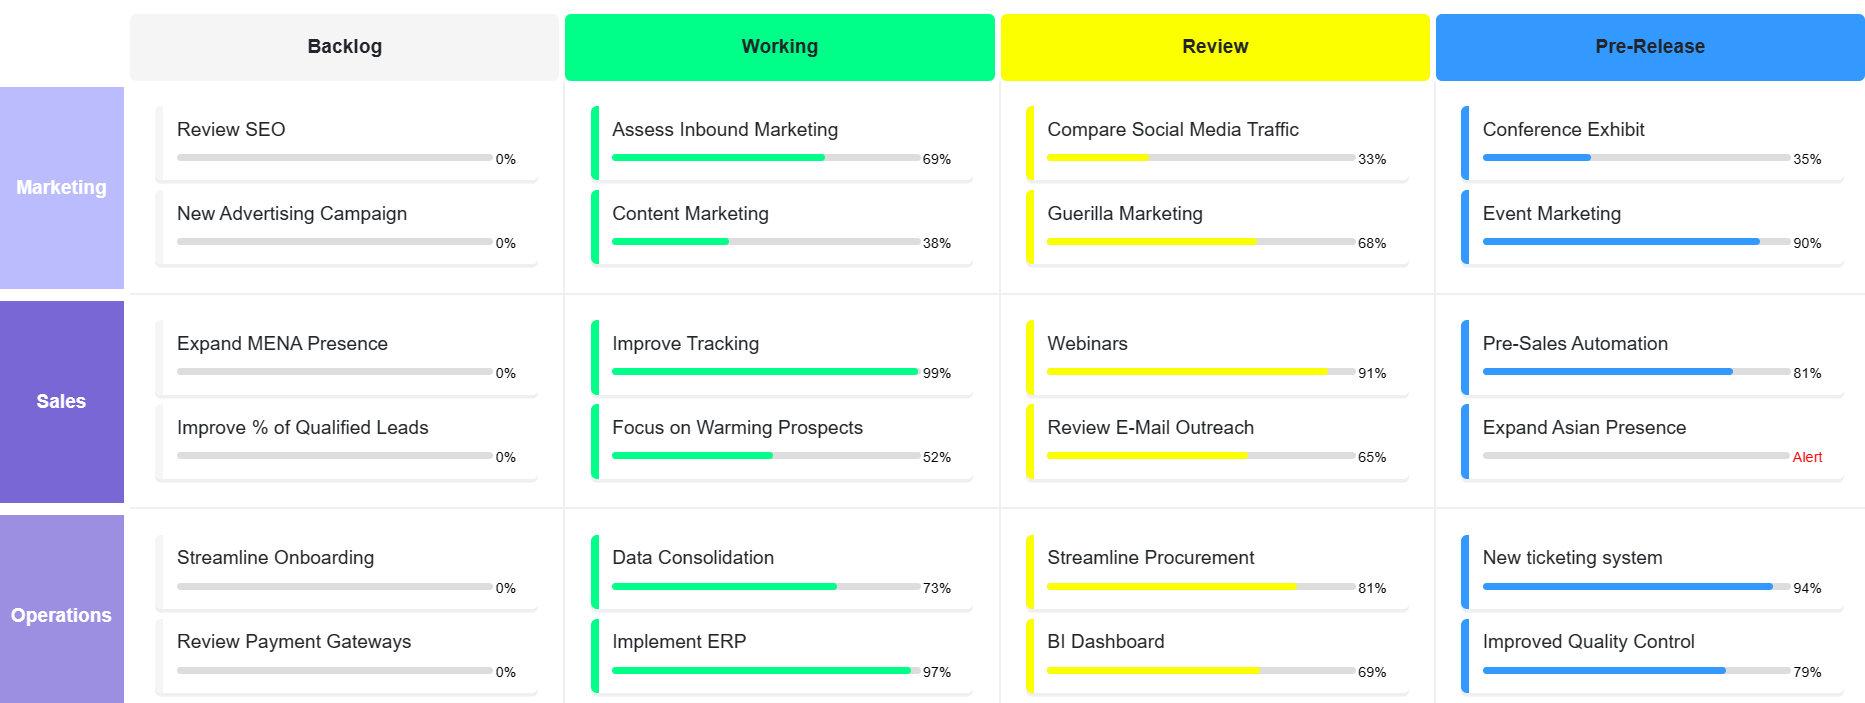
Choose your visualisations. PMOs can monitor scope, budget and duration, while teams might opt for new RFIs, reminders or unopened files.


evm-critical
Critical Earned Value
  • Critical EVM: First set a subset of people, processes, material or equipment to critical, applying the 80-20 pareto rule, where 80% of value often arises from 20% of resources/processes/features

  • Portfolio Data: At the portfolio, program and project level, understand Critical Earned Value metrics at a glance, including: Critical Planned Value, Critical Earned Value, Critical Actual Cost, Critical Cost Performance Index, Critical Schedule Performance Index, Critical Estimate at Cost and Critical Estimated Duration/SPI.

  • Traditional EVM: Standard EVM measures are also provided


OKRs & KPIs
  • OKRs: Set group-wide objectives across the organisation and outline Key Results at the team/dept or group level. Results are aggregated

  • KPIs: Set targets and monitor success for a wide range of Key Performance Indicators: Strategic, financial or operational, at the group, dept. and team level
okrs


swimlane
Roadmaps: Swimlanes
  • Strategy: Roadmaps are useful for meetings to show strategy and discuss progress. Choose your own headings, such as Backlog/Working or for a timeline select Q1 to Q4. Select Themes for the first column, such as marketing or operations

  • Alerts & Progress: Overdue is shown in red, while estimated percentage complete is displayed within each segment. Select from multiple templates


Scenario Analysis
  • Financing: Within scenario analysis you estimate total borrowing and financing costs for a best/average/worst case scenario

  • Revenues: Within scenario analysis you estimate expected revenues out to 5yrs, for a best/average/worst case scenario

  • Select Scenario Name: Within Planning simply select a scenario name already created to pre-populate this scenario and expected ROI
project-scenario-analysis-revenue


mini-dashboard
Customised Dashboards
  • Customised Dashboards: Select any number of items to add to your dashboard. This allows the PMO to view high level data, whereas the PM or teams can select different items

  • Portfolio and Project Analysis: At the portfolio, program and project level view key data at a glance. In this sample you can view Issues, Critical Tasks, Milestones and Average Capacity Utilisation. There is no limit to the number of items you add to dashboards


Team Dashboard
  • Reminders: Reminders, Alerts and Notifications can be set by users or colleagues. Alerts might trigger when something is overdue or needs urgent attention. Notifications are more general

  • Requests for Information (RFIs): RFIs are essential to liaise with clients and suppliers more efficiently. They reduce email chains and group similar topics together, to ensure everyone is on the same page. This includes new RFIs as well as new feedback on existing RFIs

  • Unopened Files & Messages: The system monitors when files are opened/downloaded or shared and counts new files/new file versions that are unopened, as well as unread messages
reminders


status-portfolio
Status Reports
  • Status Reports: View status reports at the Portfolio, Program and Project level

  • Efficient Monitoring: Stay up-to-date to know whether you are within Scope, Budget and Timeline requirements, or performance against client requirements


Detailed Portfolio Overview
  • Overview: View status reports at the Portfolio, Program and Project level

  • Efficient Monitoring: At a glance view performance of a range of portfolios, programs and projects. Understand whether you are within Scope, Budget and Timeline requirements, or just performance against client requirements. Also view budget, burn and margins
overview

Return to Project Menu


Request a demo or consultation